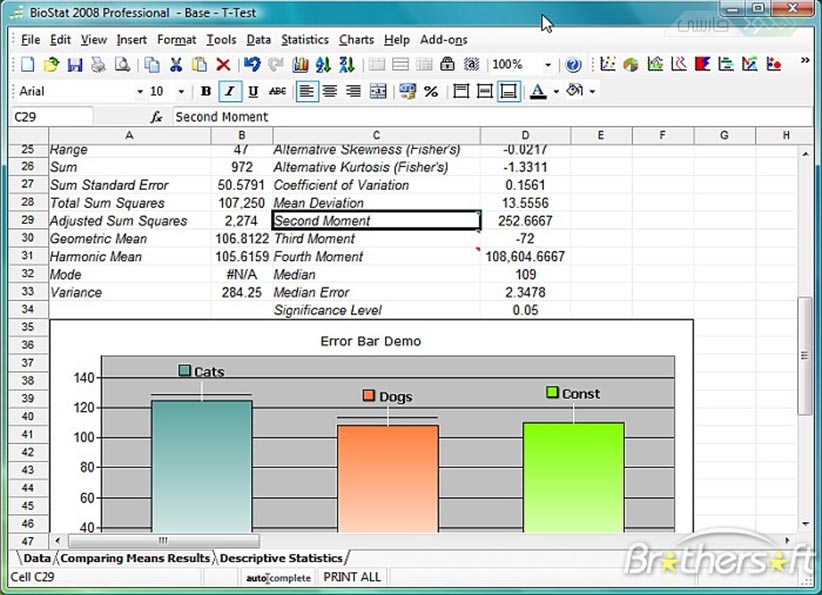
SigmaPlot is a highly professional software program for graphing and data analysis, which is much more powerful and feature-rich compared to Excel. This software provides the most effective method for creating graphs to analyze data. Although SigmaPlot is not specifically a chemistry software, it can be very useful for researchers in the field of chemistry who work with graphs and data analysis. In fact, any researcher dealing with data will find SigmaPlot extremely helpful. Civil engineers, industrial engineers, agricultural scientists, statisticians, geologists, physicists, biologists, mathematicians, and all students and faculty can benefit from using SigmaPlot for their data analysis needs.

Join over a hundred thousand researchers around the world who use SigmaPlot to easily control the details of any graph and make the necessary adjustments to their preferences. Additionally, they can create numerous publishable graphs that present results clearly for technical journals, whether for display purposes or web presentations. With the help of data analysis tools, from expert and intuitive curve fitting to advanced mathematical calculations, you can gain deep insights into your data. Use the statistical consultant, SigmaStat, which is included with SigmaPlot, to access the expertise of a professional statistical advisor, saving time and avoiding statistical errors.
Request a supercomputer!
Related links
Analysis of Management and economics software
Analysis of software in the field of physics
Analysis of electricity and electronics softwares
Analysis and classification of Mechanical Engineering software
Analysis of software in economic management industries