EViews (short for Econometric Views) is a specialized software package for estimating and simulating econometric models. It was originally developed by Quantitative Micro Software (QMS) and later acquired by IHS Inc. in 2010. The software is widely used by economists worldwide for econometric analysis, forecasting, and statistical modeling. The official website for EViews is www.eviews.com.
As of the last available update, the latest version of EViews is EViews 10, though earlier versions like EViews 8 and EViews 9.5 remain widely used.
Key Features of EViews
EViews is designed to be user-friendly, supporting both programming-based and graphical user interface (GUI)-based workflows. It is particularly valuable for:
Econometric modeling and statistical analysis
Sales forecasting
Macroeconomic predictions
Cost analysis
Policy modeling and evaluation
With an intuitive GUI featuring windows, icons, buttons, and menus, users can perform advanced econometric, statistical, and graphical analyses without requiring programming skills.
1. Data Handling and Object-Oriented Structure
EViews is built around an object-oriented framework. Common objects include:
Series (time-series data)
Equations (regression models)
Systems (simultaneous equations)
Each object has its own window and predefined procedures, making it easy to execute complex econometric analyses.
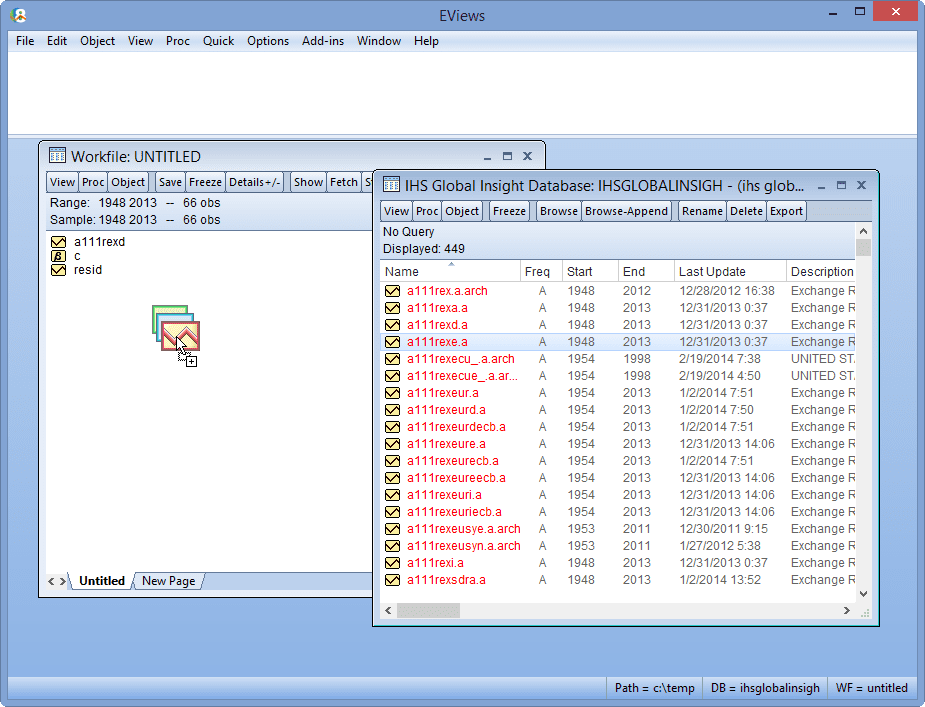
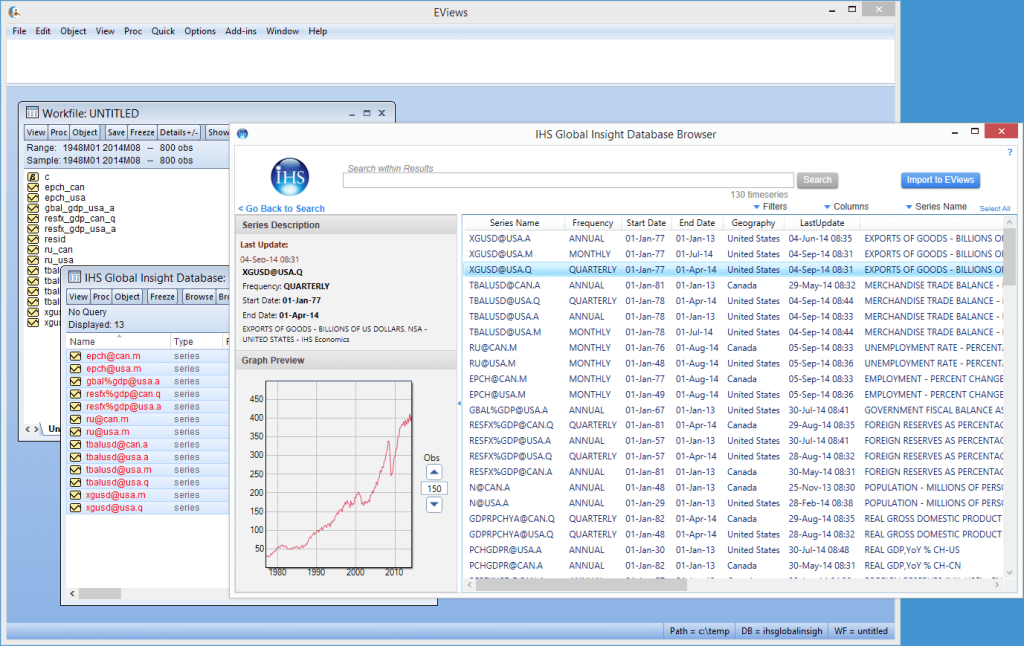
The software supports seamless data import/export from multiple formats, including:
Excel (.XLS, .XLSX)
Text files (.TXT, .CSV, ASCII)
Databases and other statistical software
Unlike many econometric tools, EViews does not require knowledge of a specific programming language to use its built-in procedures.
Eviews
2. Statistical and Econometric Tests in EViews
EViews includes a comprehensive set of econometric and statistical methods, including:
2.1 Basic Statistical Analysis
Descriptive statistics (mean, median, variance)
Hypothesis testing (ANOVA, t-tests)
Distribution analysis using histograms and quantile plots
The command line and scripting language allow advanced users to automate repetitive tasks.
Why EViews?
EViews is widely used in academia, research institutions, and financial sectors due to: ✅ User-friendly GUI (no programming required) ✅ Comprehensive econometric toolset (ideal for both beginners and experts) ✅ Fast and efficient handling of large datasets ✅ Seamless integration with Excel and other data formats ✅ Powerful forecasting & simulation capabilities
Its versatility makes it one of the most preferred econometric software solutions for time-series analysis, forecasting, and macroeconomic modeling.